Showing posts with label probability. Show all posts

Monday, July 11, 2016

Statistical Analysis of the SENSEX - Probability distribution of Local minima

So I have decided to revive my blog but as I now have a toddler who just yanked the power cable from my laptop..I will have to be quick with this article :)

Recently, while I was debating the pros and cons of Mutual fund investments with a few of my colleagues, the topic of "timing" the market came to be discussed. While it is common knowledge that it is impossible to predict the ups and downs of the market indices (like the SENSEX) on a day to day basis, I felt that a long term data analysis should yield something interesting. Even purely random events have a Gaussian distribution after all.

So I pulled up the last 37 years of daily closing values of the SENSEX from here and did the following
1) Found the minimum values of the Index on a monthly basis
2) Found the date and the day of the week that minimum value was reached

The probability distribution of the SENSEX hitting the lowest value in a month is as depicted below where the first chart illustrates the Day of the week probabilities while the second displays the Day of the month distribution.


Interesting Data Analytic conclusions
1)  The 1st day of the Month and Wednesdays are when the probability of the SENSEX being the lowest are the highest
2) The 15th of the Month and Fridays are the converse

I havent really got down to thinking about why this is the way it is but probably a lot of investments like SIPs get auto debited and channeled to the market in the beginning of the month causing a dip in prices but the data reveals that if you are dealing with index funds its better (statistically speaking) to buy during the first week of the month and sell by the 15th to maximize good return probability.

NOTE: I shall not be responsible for any losses incurred by anyone treating the above data analysis as a Stock tip. I am still recovering from my own :)


Sunday, December 1, 2013

Life and the Central Limit Theorem - An asscociation made in mathematical heaven

Too often in life we tend to generalize and associate individual behavior with the behavior of a group. Many of our social biases stem from such a tendency and what we fail to appreciate is the wonderfully complex world we live in.
The Central Limit theorem is one of those beautifully constructed mathematical models that seek to bring about a semblance of order in a chaotic world. In its simplest formulation, it provides a way of visualizing the behavior of seemingly random events. It essentially is a mathematical model of life, a life that involves a myriad of possibilities, a plethora of possible outcomes - some good some bad.
The simplest demonstration of this theorem can be obtained by the roll of an unbiased dice. If we roll one dice then at every roll we can land up with any of the six numbers from 1 - 6 and the probability of occurrence of any of these digits is the same and equal to 16.66%
However, if we now roll two dice and evaluate the sum of the digits that show up then the total number of possible outcomes goes up to 11 with the probability of a 7 showing up now being the highest. The probability is not longer uniformly distributed. This is because 7 can show up as a result of the following combinations
1 - 6
2 - 5
3 - 4
4 - 3
5 - 2
6 - 1

If we start rolling more dice simultaneously and repeat the analysis, the distributions creeps closer and closer to a normal distribution yielding the simplest demonstration of the theorem. I have coded the algorithm for evaluating this in a spreadsheet and it is available here and you can try it out. The only input required is the number of dice that you want to roll together and hit "Calculate". The code evaluates the total number of outcomes possible and then then probability distribution is plotted.
Caution: Owing to the mathematical complexity of evaluating the total number of combinations which rises exponentially with larger number of dice, do not input more than 6 as it is likely to crash your PC ( if its a 32 bit CPU). If you have a 64 bit processor then you can try a bigger number

PS: Code could have probably been written to use recursion but got lazy and hence relied on mathematical jugglery.
Case 1: When one die is used. Number of possible combinations and outcomes is 6


Case 2 : With two dice the number of combinations is 36 and outcomes is 11


Case 3: With 6 dice the number of combinations is 46656 and outcomes is 31


The moral is that a lot of unrelated events can still lead to something that is so wonderfully symmetric and this applies to more aspects of our lives then we care to think about. From the noise that affects electronic circuits (Additive White Gaussian Noise) to how the marks/ratings will be distributed among a random selection of individuals to why individuals in a group behave differently than when alone ( Mob psychology), patters of behavior and data are often more relevant than individual behavior.
As individuals we make choices but given the random nature of individual choice, the outcomes follow a Gaussian distribution which we unwittingly contribute to. Extreme cases of success and failure are the outliers on this curve while humanity's choice as a whole is the mean. Making choices closer to the mean would imply a higher probability of favorable outcome but if everyone does it then it takes away the importance of individual choice.
Neo : "Choice, the problem is choice." - Matrix

Monday, March 4, 2013

The Monty Hall Paradox

Over the years, one fact has been very subtly revealed to me by chance. That fact is..that there will always be a finite probability that I do not understand probability. That was recently underscored by my chance encounter with the Monty Hall Paradox, a seemingly obvious problem with a not so obvious solution. For folks who have come across this and still have a niggling doubt about it, I have laid out all the permutations in the below diagram along with the associated explanation. Needless to say, I had to do this to convince my self first of all.

Prerequisites for reading further:

1) What is the Monty Hall Paradox? Why on Earth do we have wikipedia? Please go here -> Monty Hall
2) An interest in Mathematics and/or
3) Extreme Boredom :-)

Ok, since you are already here, lets get to the solution. Here are the scenarios

 Explanation:
 Lets take the first three rows from the above snapshot. Here, the prize is behind the first door and the three rows list out the three possible choices that the player can make.
The player's choice is mentioned under the "Original Choice" column.
The next column shows the final outcome provided the player decides not to switch while the subsequent column shows the result in case he had decided to switch.
Taking the second row as an example, the prize is behind Door 1, the player chooses Door 2, the host then opens Door 3. The player has the option of sticking with his original choice (Door 2) and lose or switch to the only other remaining door i.e Door 1 and consequently win.

The overall success probability for all the scenarios is listed below and as counter intuitive as it may seem at first, the results speak for themselves.

The life lessons I gathered from this are
1) Your first choice is likely to be the wrong one
2) If you get the chance - Switch :-D

Sunday, October 31, 2010

Naughts and Crosses

Owing to a debate at home regarding the age old game of Naughts and Crosses I decided to do a statistical analysis of the game itself. My initial premise was that the person making the first move is at an advantage and the analysis seems to validate this. Admittedly, I just analyzed the first six moves as most games are decided by that time (truth is I got lazy after 6 rounds of iteration :-) )
Maths Alert:

If you are easily nauseated by mathematical models and concepts or are below 100 years of age then please stop reading here.

Since you have not stopped reading I sincerely pity you but anyways here are the mundane details

1) The first question to be answered of course is how many moves are possible in the game itself. Simple math tells us that the number of ways two symbols (X and O) can be arranged in 9 positions is given by 2^9 which is 512. As usual, simple maths is not sufficient as we have to take into account the rules of the game which says that the symbols "X" and "O" must be placed alternately thus invalidating many of the combinations calculated by the mentioned method. I looked at it from a different perspective and realized that the game would involve 5 "X"s and 4 "O" upon conclusion. Thus the number of ways in which 5 "X"s can be placed in 9 places is 9C5. This is 9!/(5!*4!) = 126. The remaining 4 positions can be filled by 4 "O"s in 1 way. Thus the total number of combinations possible is 126

2) Looking at the layout, it becomes apparent that there are 8 possible routes that spell victory (Figure 1). Thus the possibility that a "X" or "O" is placed on a path that may lead to victory is 8/126 = 0.06


Figure 1

3) Now the fun part :-).
For each possible moves there is a possibility that the placed symbol may lie on a number of "success" paths. Looking at the best case and worst case scenarios in each case we come up with the following:
For the first move by Mr "X" he can opt to put an "X" in positions that put the symbol on a path that is common to 4, 3 or 2 success paths. Taking the best case and worst case scenarios which look like Figure 2 we end up with probabilities of 0.24 (4*0.06) or 0.12 (2*0.06)


Figure 2

4) Now Mr "O" also has best case and worst case scenarios depending on what Mr "X" has done and we end up with the following scenarios (Figure 3)


Figure 3
The corresponding best case and worst case probabilities are therefore 0.18 and 0.06

5) Repeating this iteratively for 4 more moves we end up with the following scenarios (Figure 4)


Figure 4

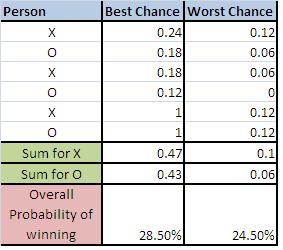
The following table presents the Best Case and Worst case probabilities for each move and then sums up the probabilities for Mr "X" and Mr "O". The average overall probability considering equal weightages for Best case and Worst case scenarios is then calculated.


6) My conclusions
a) The person beginning first has a 28.5% chance of winning
b) The person going second has a 24.5% chance of winning
c) Overall there seems to a 47% chance of a draw

NOTES: Please find below some of the answers to the questions that this blog article may prompt you to ask me.

1) Yes, I have a life
2) I do have a job
3) There was no point in doing this
4) You shouldnt bet money on this analysis
5) Oh Yeah?
6) Same to you.

:-)

Cheers
Sam

Saturday, May 2, 2009

Life - The stochastic model

I have often wondered about the meaning of life and the existential questions. I have always drawn a blank. Big surprise eh? For some reason, I just cannot come to terms with the notion that life just "is" and there is no logical reason or higher purpose behind it. If everything in nature stemmed from a few basics laws then it ought to be possible to bring about some semblance of order in the nature of things. I fully understand the problem of algorithmic compressibility and I am not looking for a way to figure out the future. I have always loved mathematics and all my initial attempts at understanding the universe were inherently mathematical.

I pondered over the fact that cause and effect are interrelated and a finite number of causes should always lead to a finite number of effects. Thus, if it is possible to limit the set of inputs, the output set should also be bounded. Under this hypothesis, if I could narrow down the number of factors that can effect a situation I could hypothetically have a very good chance of finding the outcome. Seemed simple enough but turns out that nature is far more complicated. This hypothesis kept me busy for a while and I attributed my failures to the fact that I was not accounting for all the variables.

Enter Chaos theory. It gave me nightmares. It went completely against my understanding of mathematics but here it was. I coded a computer program on one of the equations and nearly wrecked my machine but it was there and it was undeniable. It just stated that a given input can result in a wide range of outputs which seemed essentially random in nature. My initial hypothesis went out the window. Closely associated with Chaos was the concept of fractals and that puzzled me for a while. My initial consternation gave way to curiosity and I started to feel that a deeper understanding was needed to get to what Chaos was all about. It soon began to seem that Chaotic equations did settle down into a "pattern" after a while and though they do not stabilise, they do remain bounded. There was still hope. If the universe is based on Chaos then it has had enough time to settle into a pattern and we should be able to figure out the bounds.

Then came probability and gate crashed my concepts. The mathematical probability struck me as wondrous. It seemed to say that you can try doing something once and it may work, try twice and it may work but try it a zillion times and you will fail "x" percentage of the time. It was a surprising result but it was true because it is verifiable. Could life indeed be a stochastic process? Modern science does treat it as so and so you will see percentages like children in Somalia have 70% chance of survival etc etc. Statistics such as this are a clear indication that there is a probability lurking around the corner. Probability of survival, probability of success... what else? It seems we are on the verge of a scientific and philosophical breakthrough. A point in our history where we realize that there are just too many decisions to be made and each decision has a certain probability of success. The number of choices we see before us are in turn a result of the choices made earlier. So that's cause and effect. After all this, even in spite of good decisions and sound judgement it is still possible to screw up courtesy Chaos.

Which now makes me wonder about the probability of probability describing life... Hmmm... maybe another day.